

The greed-is-good consumerism endemic to capitalism, particularly the post-1989 variety has, without the danger of communism keeping it in check, run amok like a species with no natural predators.
| Katherine Alejandra Cross, The End of History and the Final Girl1
…
Katherine Alejandra Cross, The End of History and the Final Girl
Cross turns Francis Fukuyama’s End of History on its head. She says, comparing it to the recent Hyperpolitics by Anton Jager, Fukuyama ‘doesn’t just seem dated; parts of it have aged quite badly’.
Her analysis is brilliant, and the piece is far too long to summarize.
I strongly recommend reading it closely. In particular, her closing takes the perspective of the ‘final girl’ in slasher-style horror movies, the one that makes it through the night, as an antagonist against a capitalism run amok:
The ground is shifting because the Final Girl is waking up to the Last Men and we are going to do more than mark time: we are going to survive the night.
We do not have to yield to the car dealership owners who have made their midlife crises a geostrategic problem for the entire world.
We can yet end this madness. Bloodied, frightened, unwilling, but also unbowed. We can pick up a knife and live to see dawn again.
Cross cites the authors of The End of the End of History, Alex Hochuli, George Hoare, and Philip Cunliffe, who argued that Fukuyama was wrong: it is not liberal democracy that triumphed once the Soviet Union collapsed, but capitalism. Cross herself, though, buys the idea that the nascent socialism finding a place in the US is the reclamation of earlier dreams of liberal democracy:
The struggles of the future will be fought over the shape of liberal democracy. The battle will be fought not between liberal democracy and a fully-formed alternative with its own institutions and militant cadres, but between liberal democracy and a screaming void.
Capitalism Run Amok
Let’s pinpoint exactly what ‘running amok’ means, over the past decades since Fukuyama declared the end of history: the ascendance of liberal democracy. Which really meant the ascent of unfettered capitalism.
Let’s zoom into one aspect of this, one that hits us as individuals directly: the shrinking percentage of money flowing to workers in our economy as a whole, as employees in American organizations. Just a few charts from a recent report, Wage suppression in 10 charts, by the Economic Policy Institute. [All emphasis mine.]
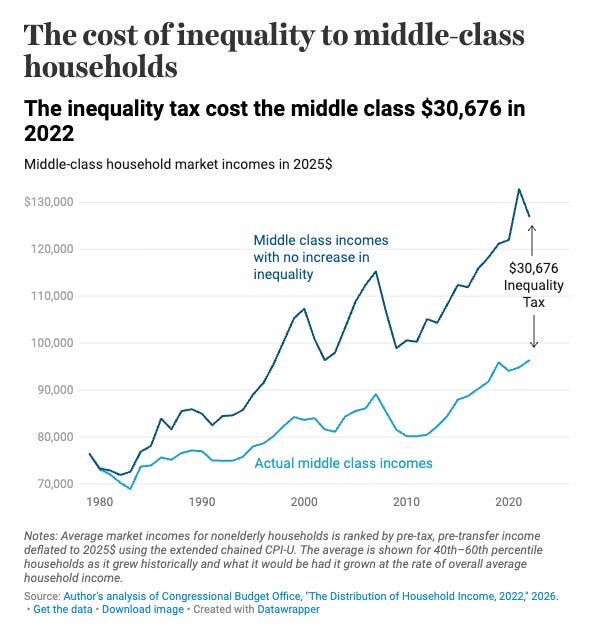
The stakes of rising inequality for middle-income households in the United States are enormous. By 2022, steadily rising inequality was costing these households roughly $30,000 per year.
Figure 1 compares actual income growth of the middle fifth of nonelderly households since 1979 with what this income growth could have been had inequality not increased. The graph highlights market-based incomes because rising inequality was driven entirely by this income category—earnings from the labor market and business income like dividends and interest payments. We focus on incomes of nonelderly households because inequality largely stemmed from unbalanced labor market power, and nonelderly income is dominated by labor earnings.
In 2022, the average market income of the middle fifth of households was $96,335. But their income would have been $127,011—roughly 32% (over $30,000) higher—had inequality not increased after 1979. Put another way, if the middle fifth of households had seen market income grow at the overall average rate—an overall average pulled up by stratospheric growth at the very top—their income could have been roughly $30,000 higher by 2022.
The rising inequality is a function of 1/ the changes in tax policy over time, where higher earners benefited from lower taxes, and 2/ corporate policies to divert the results of growing productivity to capital and away from labor.
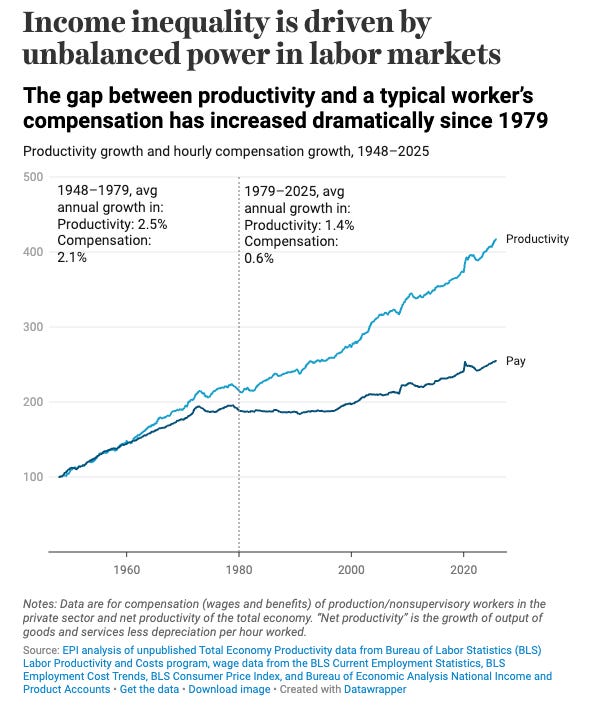
The inequality in market-based incomes highlighted in Figure 1 was overwhelmingly driven by unbalanced power in labor markets that prevented typical workers from seeing their paychecks keep up with overall economic growth. Figure 2 shows hourly pay (including benefits) for the roughly 80% of the private-sector workforce who are not managers or supervisors and a measure of economy-wide productivity—defined as the income generated in an average hour of work in the U.S. economy. The rising gap between these lines is how we define wage suppression—keeping typical workers’ wage growth slower than growth in incomes in the rest of the economy.
In the three decades following World War II, hourly compensation for the vast majority of workers rose 2.1% on an annualized basis, roughly in line with productivity growth of 2.5%. But for most of the last five decades (except for a brief period in the late 1990s), pay for the vast majority lagged further behind overall productivity. Over the entire 1979 to 2025 period, hourly pay for a typical worker rose just 0.6% while productivity increased 1.4% on an annualized basis. This means that workers have been producing far more than they receive in their paychecks and benefit packages from their employers, and this wedge has grown substantially over time. Some of those gains in productivity went to greater profits for corporations but an even larger portion went to highly paid managers and professionals, resulting in a vast increase in wage inequality over the last five decades.
Had we pursued policies to support broad-based wage growth—instead of wage suppression—typical workers would have much higher pay today. In fact, if annual pay for production and nonsupervisory workers had instead tracked productivity growth since 1979, their pay would be 45% higher, or $30,000 more than it is today.
Why can’t people save to buy a house, or pay rent, or afford a $100 cash emergency? Because corporate policies, adopted across almost all companies and industries, deviated from the post-WWIII, New Deal trend lines, with politicians working hard to shift tax policies to benefit the few at the expense of everyone else.
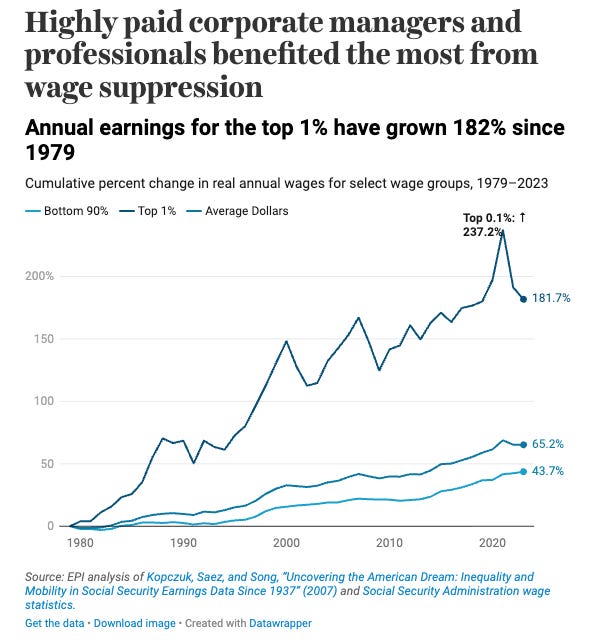
The largest portion of the growing wedge between productivity and pay can be explained by the astronomical wage growth for those at the highest end of the wage distribution. The ability of those at the very top to claim an ever-larger share of overall wages is evident in Figure 4. Annual earnings for the top 1% have grown 182% since 1979, while wages of the bottom 90% have grown just 44%. If the wages of the bottom 90% had grown at the average pace over this period—meaning that wages grew equally across the board—then wages for the bottom 90% would have grown by 65%, far higher and roughly 50% faster than the actual growth experienced. Earnings are so concentrated at the top that average growth is well above the 90th percentile of the earnings distribution. That means workers need to be among the highest 10% of wage earners to even experience average earnings growth. And everyone else—more than 90% of the workforce—saw less than average growth over the last four and a half decades.
Any progressive movement in America should start by fixing glaring wage inequality.
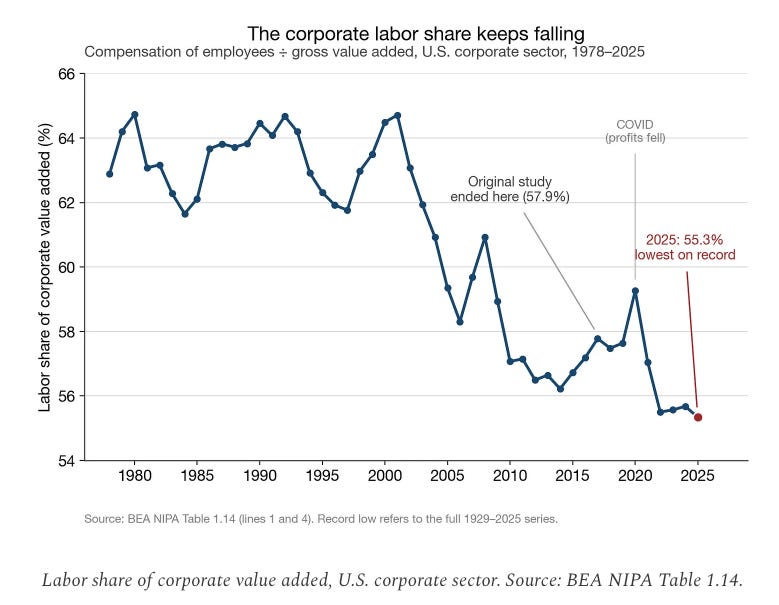
In 2025, the labor share of ‘corporate value added’ fell to 55.3%, from a peak in 1980-2000 of over 64%. George W. Bush’s tax cuts of 2001 and 2003 contributed strongly to the post-2000 labor share falling, according to The Legacy of the 2001 and 2003 “Bush” Tax Cuts:
High-income taxpayers benefitted most from these tax cuts, with the top 1 percent of households receiving an average tax cut of over $570,000 between 2004-2012 (increasing their after-tax income by more than 5 percent each year). Despite promises from proponents of the tax cuts, evidence suggests that they did not improve economic growth or pay for themselves, but instead ballooned deficits and debt and contributed to a rise in income inequality.
The chart above and the following description of two critical tax laws from Trump’s time in the White House are from Why the Labor Share Keeps Falling: Taxes! [emphasis mine]:
The Tax Cuts and Jobs Act of 2017 did two things that mattered on the labor share front. It cut the C corporation rate from 35 to 21 percent. And it created the Section 199A deduction, which lets pass-through owners shave their top rate to 29.6 percent (provided they aren’t in a “specified service” business like law or medicine). The One Big Beautiful Bill Act of 2025 then made the 199A deduction permanent, kept the 20 percent rate, held the top individual tax rate at 37 percent, and loosened the limits on who qualifies for 199A. The latest pass-through regime cost about $740 billion over ten years.
Basically, business owners and top management have sheltered a much larger share of corporate profits from taxation, and distributed it to themselves, thanks to Congress and various presidents. Notably, those funds were not shared with labor and were not taxed at earlier 1980-2000 rates, so the government saw significantly less money as well.
So the next time you hear that the country is $36 trillion in debt, remember that corporate policies, tax laws, and pointless wars are the cause, not welfare fraud, too many immigrants, or overly generous health insurance subsidies. Realize that business owners and managers choose to shortchange their non-managerial workers.
The affordability crisis is two-sided: on one side, wages — except for top management and specialized professionals — are being suppressed, and on the other side, the necessities of life are rising much faster than the rate of pay increases. In both cases, the working and middle classes are squeezed by policies and politics that benefit only the top few percent.
The only way to get our economy working for everybody is to change tax and corporate regulations so capitalism is no longer running amok.
Please support my work with a paid subscription, which I have made as marginal as possible. If you can’t afford yet-one-more-subscription, please help me by restacking this post to spread the word.
